
Looking for the newest month? See the latest market update. All months: media page and archive.
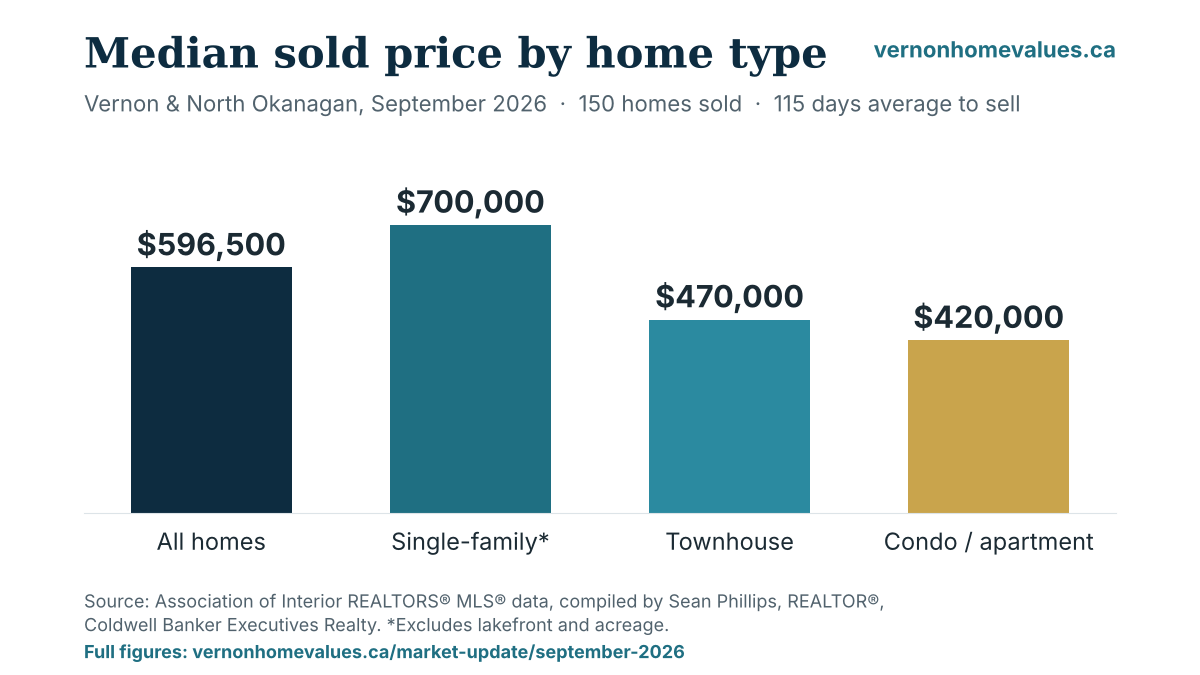
The short answer: In September 2026, the median price of a home sold in Vernon and the North Okanagan was $596,500, and the median single-family home (excluding lakefront and acreage) sold for $700,000. 150 homes sold, down 16% from September 2025, and homes took an average of 115 days to sell at about 96% of list price.
Updated October 13, 2026 with September 2026 figures from the Association of Interior REALTORS®. Next update: early November 2026.
Reporters and editors: how to credit these numbers
Copy this credit line:
Source: Association of Interior REALTORS® MLS® data, compiled by Sean Phillips, REALTOR®, Coldwell Banker Executives Realty. Full figures: vernonhomevalues.ca/market-update/september-2026/Web version with link: Source: Association of Interior REALTORS® MLS® data, compiled by Sean Phillips, REALTOR®, Coldwell Banker Executives Realty. Full figures at vernonhomevalues.ca
Watch: September 2026 market update

Watch page and chapters: Vernon Real Estate Market Update: September 2026 Numbers →
September 2026 at a glance
| North Okanagan, all property types | September 2026 | August 2026 | September 2025 |
|---|---|---|---|
| Homes sold | 150 | 135 | 179 |
| New listings | 278 | 270 | |
| Active listings at month end | 1,467 | 1,496 | |
| Median sale price | $596,500 | $607,000 | |
| Average sale price | $677,930 | $644,903 | |
| Average days to sell | 115 | 94 | |
| Sale price as % of list price | 95.8% | 94.3% | |
| Months of inventory** | about 9.8 | about 11.1 |
Median price by home type, September 2026
| Home type | Median price | Homes sold | Average price |
|---|---|---|---|
| Single-family (excluding lakefront and acreage) | $700,000 | 64 | $789,991 |
| Townhouse | $470,000 | 19 | $490,247 |
| Condo or apartment | $420,000 | 13 | $411,051 |
*Single-family excludes lakefront homes and acreages. **Months of inventory is worked out by Sean Phillips by dividing active listings by that month's sales. The North Okanagan figures cover all property types, including land, and Vernon is not reported separately. Board figures are as reported October 1, 2026; the Association notes that later entries can change its totals.
What it means
- Buyers have time and choice. With almost ten months of inventory, there's room to negotiate, especially on homes that have been on the market a while.
- Sellers: price it right from day one. Homes priced to the market are still selling close to asking, at about 96% of list price on average. Homes priced high are the ones sitting.
- Sales are recovering from a slow summer. September sales rose from 135 in August to 150, though they were still 16% below September 2025.
- Prices are easing a little. The overall median slipped from $607,000 in August to $596,500 in September. The single-family median fell further, from $754,000 in August to $700,000, about 5% below September 2025.
Frequently asked questions
What is the average home price in Vernon right now?
In September 2026 the average sale price across all property types in the North Okanagan, which includes Vernon, was $677,930 and the median was $596,500. The median single-family home (excluding lakefront and acreage) sold for $700,000, townhouses for $470,000 and condos or apartments for $420,000. Source: Association of Interior REALTORS®.
Are home prices in Vernon going down?
Prices are easing a little. The North Okanagan median price was $596,500 in September 2026, compared with $607,000 in August 2026. The single-family median (excluding lakefront and acreage) fell from $754,000 in August to $700,000, about 5% below September 2025. Sales picked up from 135 in August to 150 in September but were down 16% from September 2025, so buyers have more choice and more time.
Is Vernon a buyer's or seller's market right now?
It leans toward buyers. With 1,467 active listings and 150 sales in September 2026, there were about 9.8 months of inventory, and homes took an average of 115 days to sell. Well-priced homes still sell close to asking, at about 96% of list price on average.
How long does it take to sell a house in Vernon?
In September 2026, homes in the North Okanagan took an average of 115 days to sell, up from 94 days in August 2026. Days to sell varies a lot by neighbourhood and price; see the neighbourhood table on this page for Vernon areas.
Neighbourhood market updates: September 2026
Each neighbourhood page has its own September 2026 update: home values by type, days to sell, homes for sale now and what it means, with a short video. Figures are for the 12 months to September 28, 2026, excluding manufactured homes.
- Adventure Bay market update: 20 sold in 12 months, median $1,212,500, 23 for sale now · watch the video (1:38)
- Bella Vista market update: 78 sold in 12 months, median $814,970, 25 for sale now · watch the video (1:43)
- BX (North and South) market update: 57 sold in 12 months, median $945,000, 31 for sale now (also: South BX) · watch the video (2:01)
- Central Vernon market update: 127 sold in 12 months, median $395,000, 77 for sale now · watch the video (1:44)
- Coldstream market update: 104 sold in 12 months, median $930,550, 59 for sale now · watch the video (1:37)
- East Hill market update: 123 sold in 12 months, median $670,000, 44 for sale now · watch the video (1:38)
- Foothills market update: 40 sold in 12 months, median $994,450, 25 for sale now · watch the video (1:35)
- Harwood market update: 67 sold in 12 months, median $550,000, 31 for sale now · watch the video (1:50)
- Lavington market update: 8 sold in 12 months, median $1,023,524, 11 for sale now · watch the video (1:25)
- Middleton Mountain market update: 60 sold in 12 months, median $857,500, 47 for sale now (also: Coldstream side) · watch the video (1:35)
- Mission Hill market update: 53 sold in 12 months, median $620,000, 11 for sale now · watch the video (1:37)
- Okanagan Landing market update: 87 sold in 12 months, median $658,000, 75 for sale now · watch the video (1:52)
- Okanagan North market update: 45 sold in 12 months, median $410,000, 34 for sale now · watch the video (1:44)
- Predator Ridge market update: 45 sold in 12 months, median $1,150,000, 60 for sale now · watch the video (1:44)
- South Vernon market update: 19 sold in 12 months, median $575,000, 11 for sale now · watch the video (1:29)
- Swan Lake West market update: 34 sold in 12 months, median $625,000, 21 for sale now · watch the video (1:38)
- The Outback market update: 10 sold in 12 months, median $692,500, 8 for sale now · watch the video (1:12)
- Westmount market update: 19 sold in 12 months, median $588,000, 11 for sale now · watch the video (1:27)
Vernon neighbourhoods, last 12 months
| Neighbourhood | Median sold price | Sold (12 mo) | Median days on market | Sold vs. asking | For sale now |
|---|---|---|---|---|---|
| Middleton Mountain (Coldstream) | $1,240,000 | 17 | 64 | 95.7% | 16 |
| Adventure Bay | $1,212,000 | 20 | 46 | 97.6% | 20 |
| Predator Ridge | $1,105,000 | 49 | 104 | 96.5% | 65 |
| Foothills | $1,034,000 | 37 | 47 | 98.4% | 27 |
| Lavington | $1,024,000 | 8 | 126 | 98.3% | 11 |
| North BX | $998,000 | 46 | 57 | 96.4% | 24 |
| Coldstream | $942,000 | 104 | 56 | 97.4% | 57 |
| South BX | $865,000 | 8 | 52 | 96.7% | 4 |
| Bella Vista | $807,000 | 78 | 59 | 97.8% | 26 |
| Middleton Mountain (Vernon) | $800,000 | 43 | 43 | 98.0% | 24 |
| East Hill | $665,000 | 123 | 44 | 97.6% | 44 |
| Okanagan Landing | $664,000 | 88 | 52 | 97.8% | 80 |
| Mission Hill | $629,000 | 52 | 31 | 97.7% | 17 |
| Swan Lake West | $625,000 | 34 | 68 | 96.6% | 21 |
| Westmount | $588,000 | 19 | 34 | 97.4% | 10 |
| South Vernon | $575,000 | 19 | 35 | 97.8% | 11 |
| Harwood | $550,000 | 66 | 39 | 97.8% | 30 |
| Okanagan North | $410,000 | 45 | 66 | 96.8% | 35 |
| City of Vernon (central) | $385,000 | 124 | 43 | 97.3% | 70 |
| All Vernon-area neighbourhoods above | $690,000 | 982 | 51 | 97.4% | 595 |
Houses, townhomes, half duplexes and condos; manufactured homes excluded. Association of Interior REALTORS® MLS® System, 12 months ending September 28, 2026. Compiled by Sean Phillips, not the Association; deemed reliable but not guaranteed.
For more detail on your part of town, see home values by neighbourhood. For your specific home, ask for a free evaluation.
More market videos

Watch page and chapters: Why Vernon sellers are pulling their listings →

Watch page and chapters: Vernon real estate from July to August 2026: what's next? →

Watch page and chapters: How wildfire seasons affect Okanagan property values →

Watch page and chapters: Council rejects 3,500 homes: what it means for Vernon values →
Source: Association of Interior REALTORS®, North Okanagan statistics, September 2026 and August 2026. Neighbourhood table: MLS® sales compiled by Sean Phillips. Figures are general information, not an appraisal of any home. Sean Phillips, REALTOR®, Coldwell Banker Executives Realty. Each office is independently owned and operated. Not intended to solicit buyers or sellers currently under contract.